
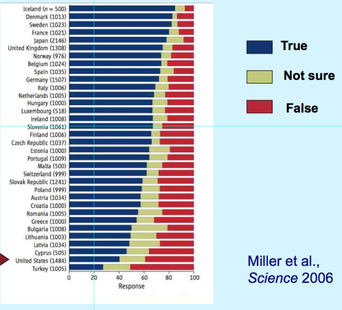
Graph of the acceptance of the evolutionary theory based on country.(figure is from Miller et al. 2006)
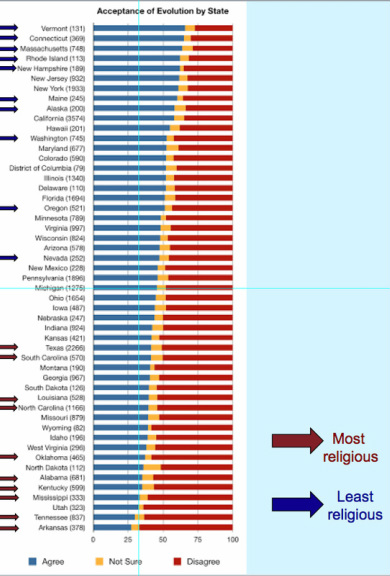
Acceptance of the theory based on each state.
This graph shows that the southern states (such as Alabama) are more religious than the northern states.(figure is from Miller et al. 2006)
This graph shows that the southern states (such as Alabama) are more religious than the northern states.(figure is from Miller et al. 2006)
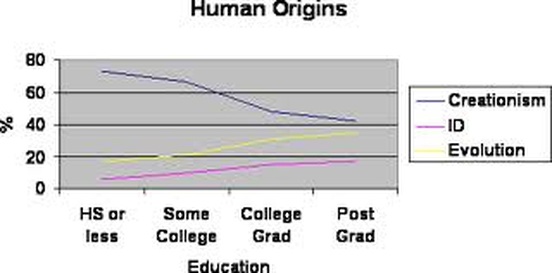
This graph shows that as we continue our education. We gradually believe more in evolution and less creationism.
(these statistics were published in the Skeptical Inquirer’s
report):
(these statistics were published in the Skeptical Inquirer’s
report):
