
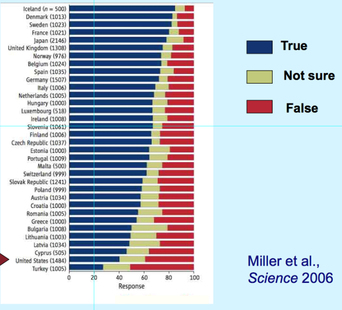
Graph of the acceptance of the evolutionary theory based on country.
(figure is from Miller et al. 2006)
(figure is from Miller et al. 2006)
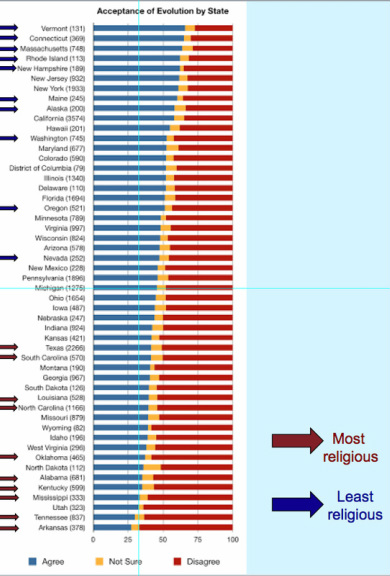
Acceptance of the theory based on each state.
This graph shows that the southern states (such as Alabama) are more religious than the northern states.
(figure is from Miller et al. 2006)
This graph shows that the southern states (such as Alabama) are more religious than the northern states.
(figure is from Miller et al. 2006)
This graph shows beliefs from students as they go throughout deferent levels of education.
these statistics were published in the Skeptical Inquirer’s
report
these statistics were published in the Skeptical Inquirer’s
report
